Viewing our collected logs
Now that we have a good understanding of the load, let’s explore the logs generated by WordPress and sent to Cloudwatch by the Fluentd agent.
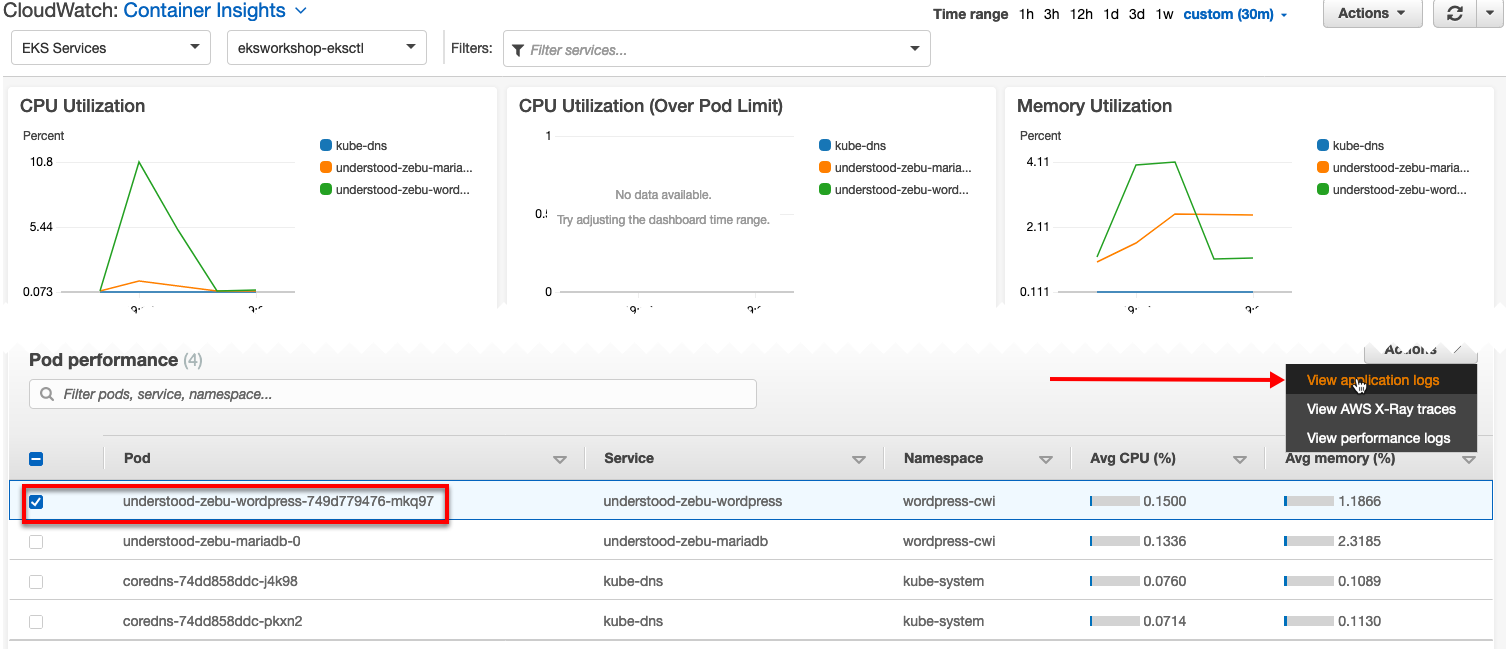
From the CloudWatch Container Insights browser tab:
- Scroll down to the Pod performance section.
- Select the WordPress pod.
- Select application logs from the Action menu.

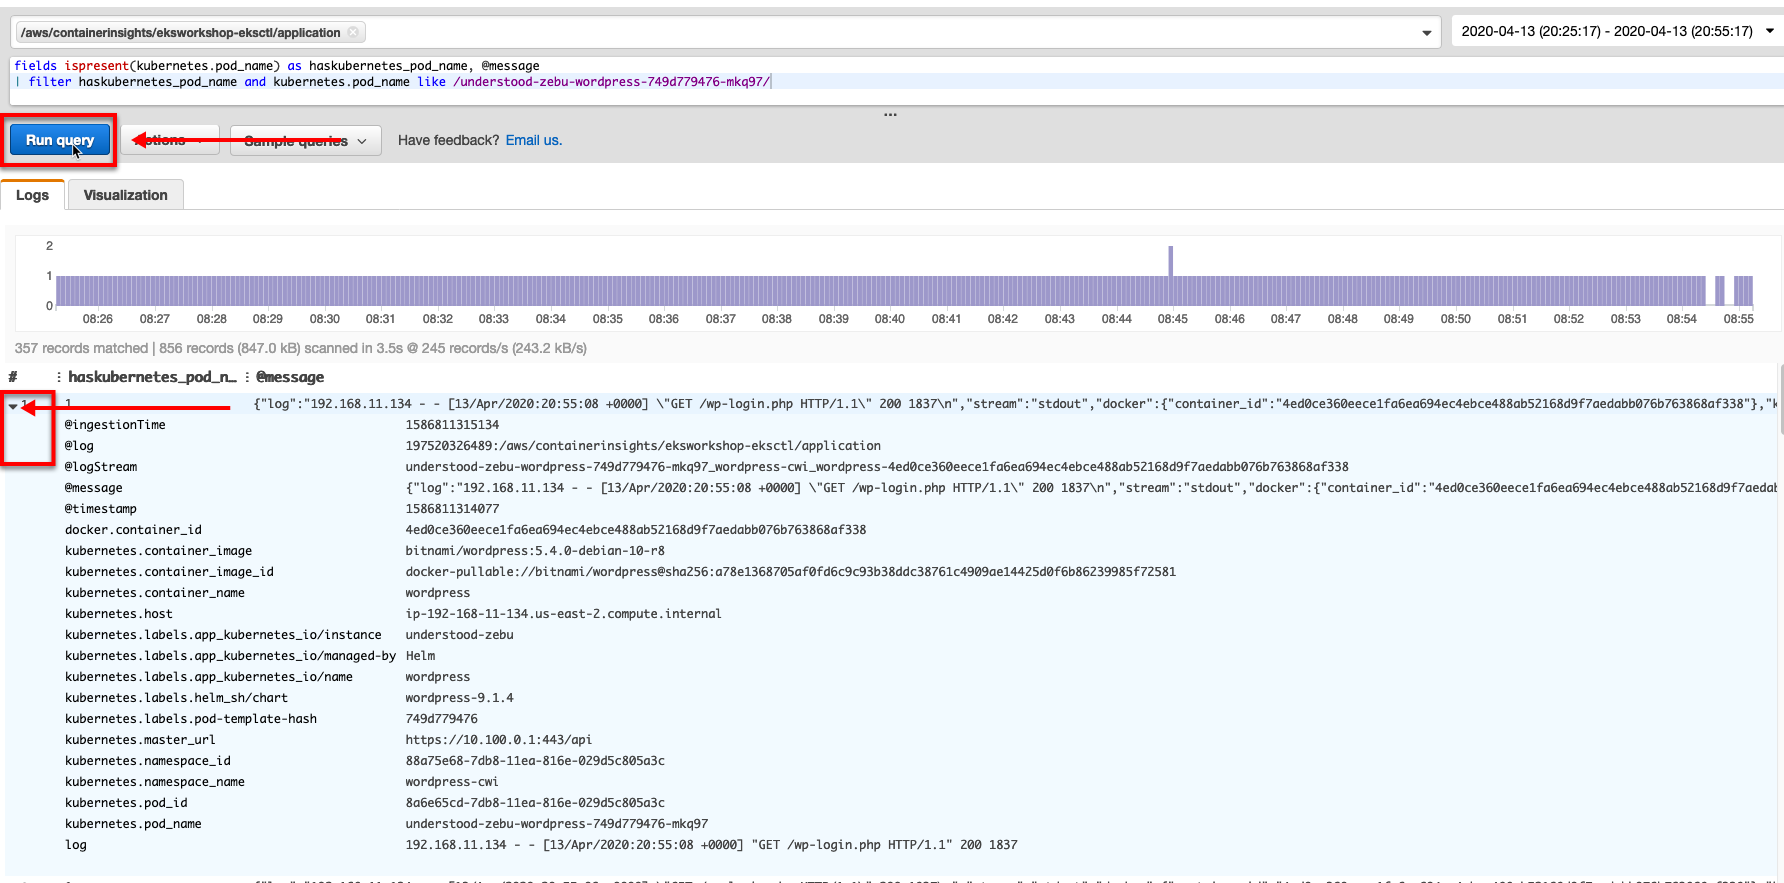
The last action will open the CloudWatch Logs Insights UI in another tab.
Click the Run query button and expand one of log line to look at it.

Fluentd has split the JSON files into multiple fields that could be easily parsed for debugging or to be included into Custom Application Dashboard.
CloudWatch Logs Insights enables you to explore, analyze, and visualize your logs instantly, allowing you to troubleshoot operational problems with ease. You can learn more about CloudWatch Logs Insights here.